8.2 EMP_scatterplot
A scatter plot is a plot that uses points on a Cartesian coordinate system to represent how two or more variables are distributed.
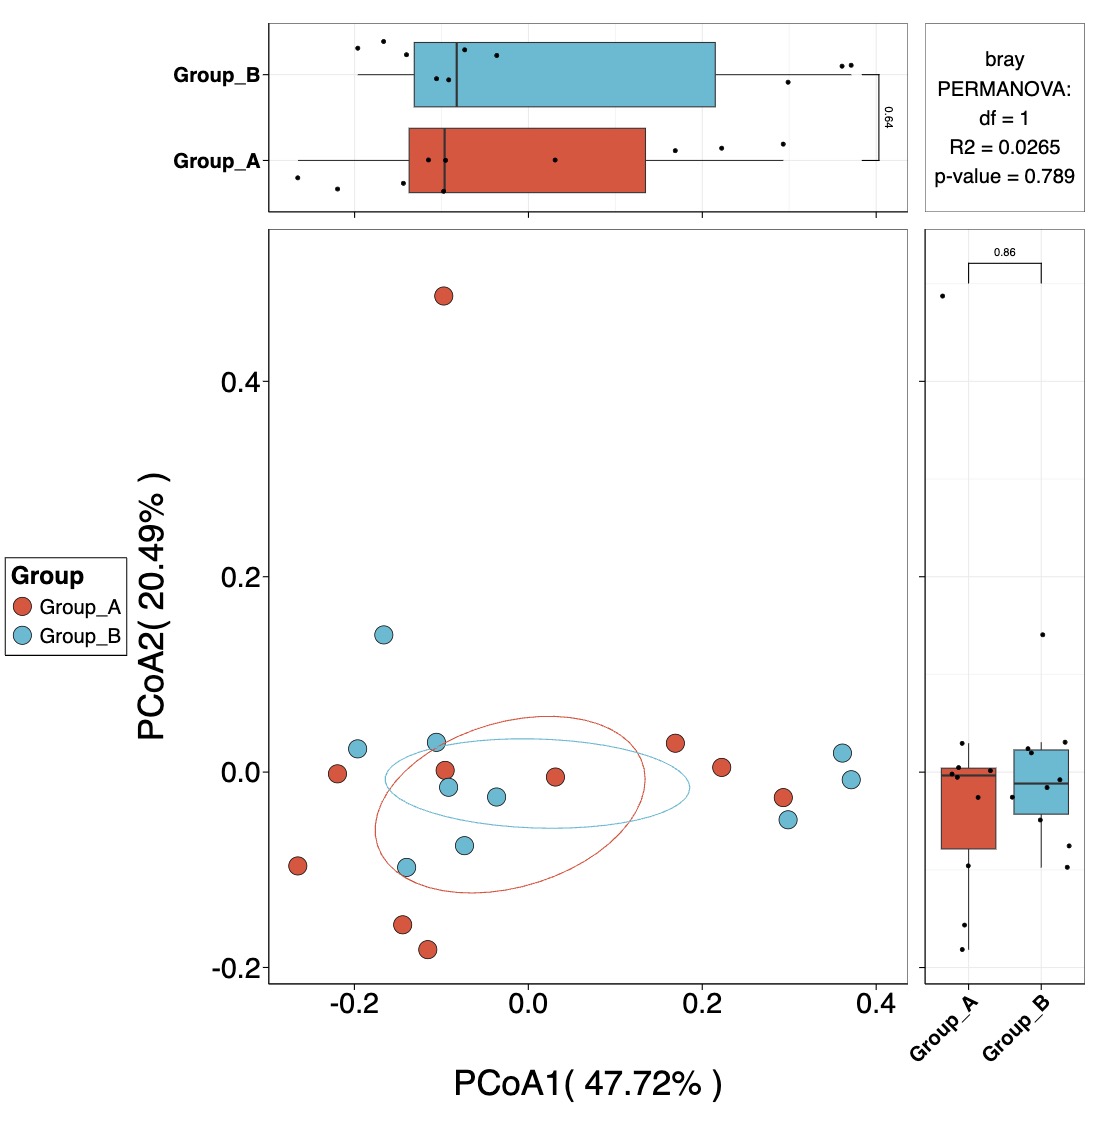
8.2.1 Scatterplot for reduced dimension result
Note:
Specify the parameter
Specify the parameter
show to observe the dimensionality reduction results from the three dimensions of p12, p13, and p23, and provide an interactive html.
🏷️Example:
MAE |>
  EMP_assay_extract('taxonomy') |>
  EMP_identify_assay(method='default',estimate_group = 'Group') |>
  EMP_collapse(estimate_group = 'Genus',collapse_by = 'row') |>
  EMP_dimension_analysis(method = 'pcoa',distance='bray') |>
  EMP_scatterplot(estimate_group='Group',show='p12html',ellipse=0.3)